
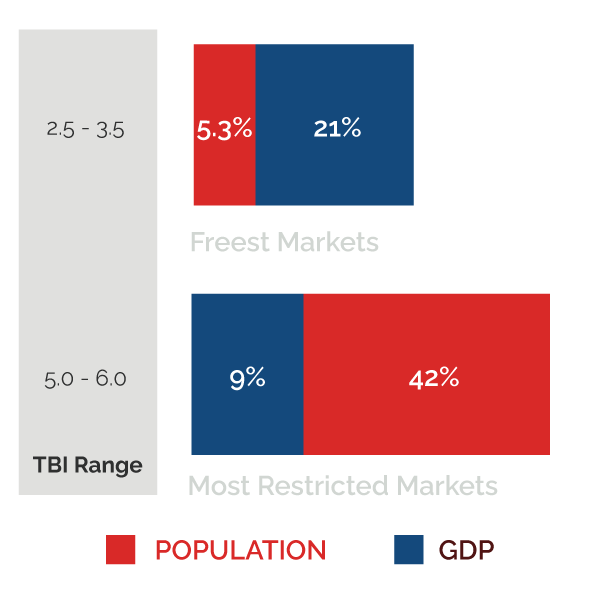
Only 5.35% of the world’s people live in the freest markets where they produce 21% of global GDP! The most restricted markets are home to 42% of world’s population, but the produce only 9% of global GDP.

Western Europe led in imposing Digital Trade Barriers, including digital taxes, content moderation, and data flow restrictions.
Only 5.35% of the world’s people live in the freest markets where they produce 21% of global GDP! The most restricted markets are home to 42% of world’s population, but the produce only 9% of global GDP.
Western Europe led in imposing Digital Trade Barriers, including digital taxes, content moderation, and data flow restrictions.
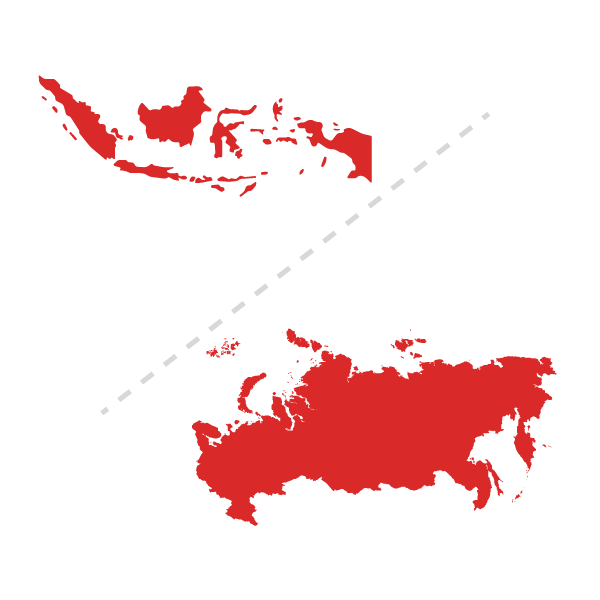
India and Russia deployed the most trade barriers greatly restricting trade and imposing other economic and social costs.
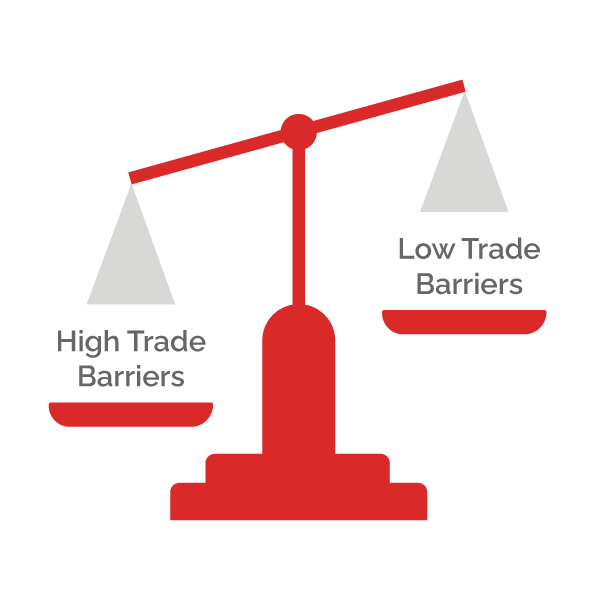
Lower trade barriers are strongly associated with prosperity & freedom; higher trade barriers with corruption & abuse of press.

Non-Tariff Barriers are commonly used by High Income countries to restrict trade, whereas other income groups tend to distort trade with Tariffs and Services Restrictions.
India and Russia deployed the most trade barriers greatly restricting trade and imposing other economic and social costs.
Lower trade barriers are strongly associated with prosperity & freedom; higher trade barriers with corruption & abuse of press.
Non-Tariff Barriers are commonly used by High Income countries to restrict trade, whereas other income groups tend to distort trade with Tariffs and Services Restrictions.